2023 Salary Survey: How signage trends continue to evolve with the times
by carly_mchugh | 6 December 2023 2:56 pm
 By Carly McHugh
Each year, we ask our readers to weigh in on their careers and the current state of the industry. Questions range from experience and education, job satisfaction, and income to company profits and an outlook on today’s signage market. The results usually differ to a degree, compared to the previous year. However, there is still the possibility for some interesting surprises to reveal themselves.
These answers offer insight on the current state of Canada’s sign industry,
as well as provide foresight into what we can expect on the horizon.
The following are the collected results of our 17th annual survey, submitted anonymously, along with the trends they revealed for the past year and beyond.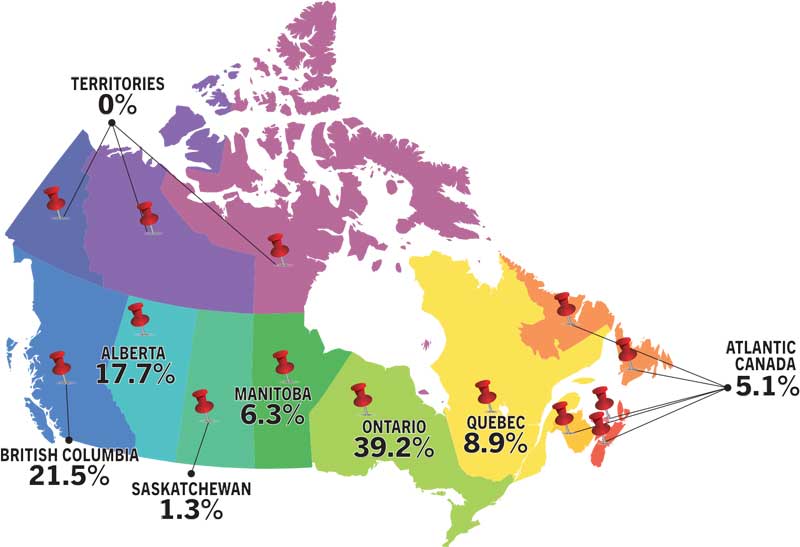 [1]
[1]
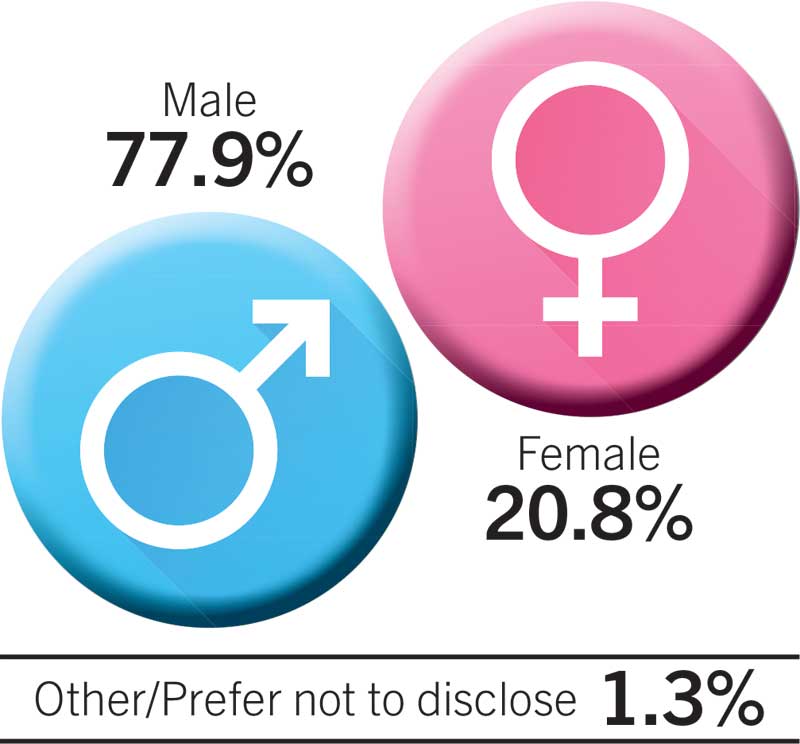
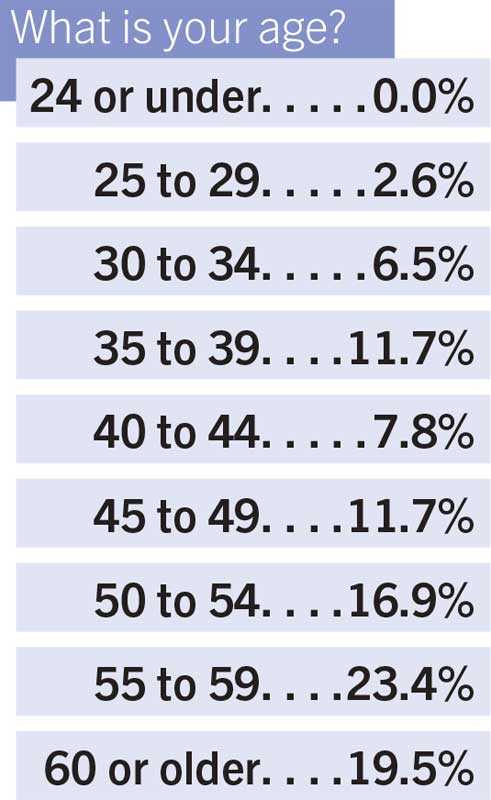
Basic demographics
Responses came in from coast-to-coast, with Ontario once again leading the charge, followed by British Columbia, Alberta, and Quebec. The number of respondents from Manitoba was up 2.9 per cent from 2022.
The survey also shows the industry continues to be dominated by men, who make up more than three-quarters of responses. However, this number has decreased by 4.6 per cent compared to last year. The majority of respondents were in the 50-plus age group, while 40.3 per cent were under the age of 50. Those between the ages of 35 and 49 decreased to 31.2 per cent, compared to 38.7 per cent in 2022, while the number of respondents in the 25 to 29 age group grew from 1.4 per cent to 2.6 per cent.
-
 [2]
[2]
 [2]
[2]
-
[3]
 [3]
[3]
The relationship between experience and career path
The survey data shows half of all respondents have at least two decades of experience in the industry. In fact, those who have more than 30 years of experience represented the largest group (26 per cent). The number of respondents who have been in the industry for less than 15 years saw a 0.7 per cent decrease compared to last year. However, the amount of people who have been in the industry for 10 to 14 years increased by a full three per cent compared to 2022.
In an interesting turn of events, the largest increase in tenure was from those who had been with their current company for less than five years. Over the previous two years, this increase was seen among 25- to 30-year veterans in the industry.
Further, the number of respondents who have been with their current company for more than 20 years decreased from 37.1 per cent in 2022 to 32.9 per cent in 2023—a difference of 4.2 per cent.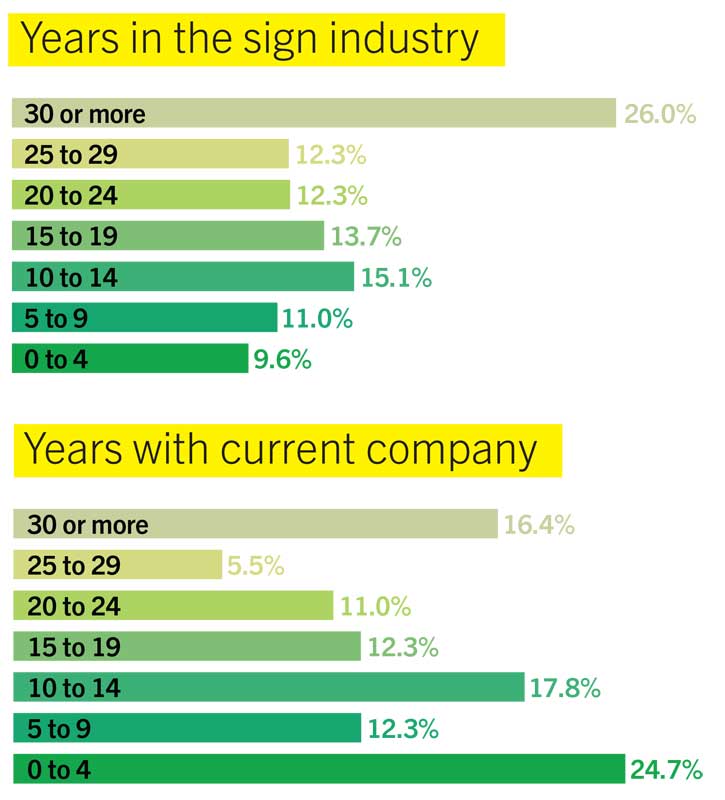 [4]
[4]
Who are you?
Sign Media Canada provides leaders in the industry with the latest news, products, services, and techniques related to their craft. The magazine has a huge following—from business owners and signmakers to installers and fabricators. Once again, the largest number of respondents selected “owner” as their job description. This was followed by sales executive/project manager, graphic designer, and signmaker/designer/fabricator. A good number of respondents also had jobs which best fit into the “other” category.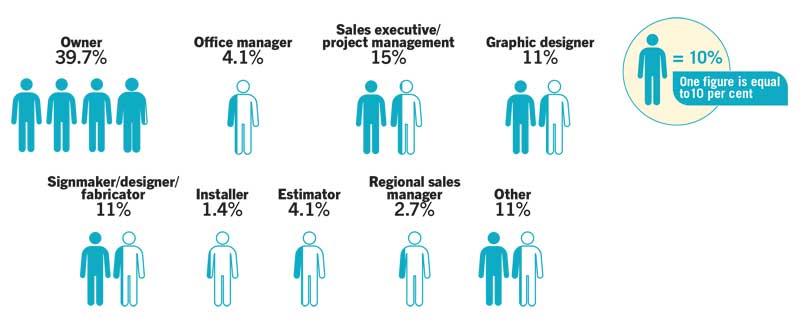 [5]
[5]
Who makes what?
Three-quarters of the sign industry workers surveyed earn $60,000 or more per year. The number of respondents in this group is up 19.1 per cent compared to last year.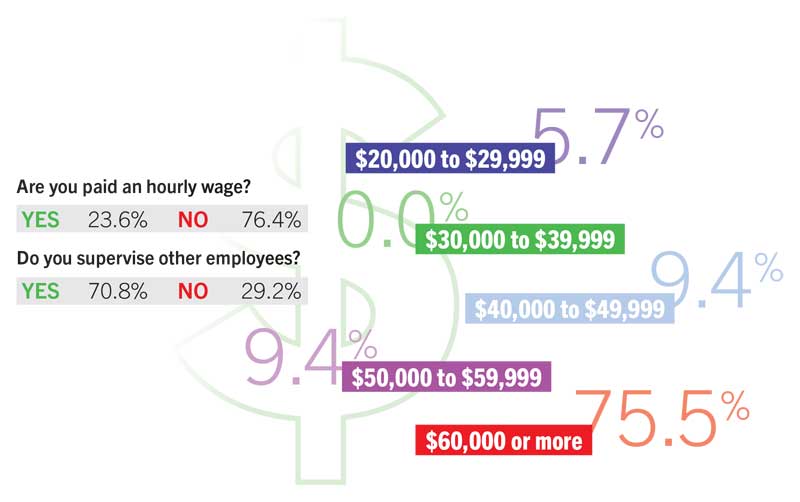 [6]
[6]
Education
More than half of respondents (53.3 per cent) have earned a post-secondary degree, while 30 per cent have degrees related to the industry. This is down just 1.8 per cent compared to last year, but still a significant increase compared to 2020 and 2021. Less than one-quarter of respondents (19.5 per cent) have some college education, but no degree, or hold a high school diploma or equivalent (20.8 per cent).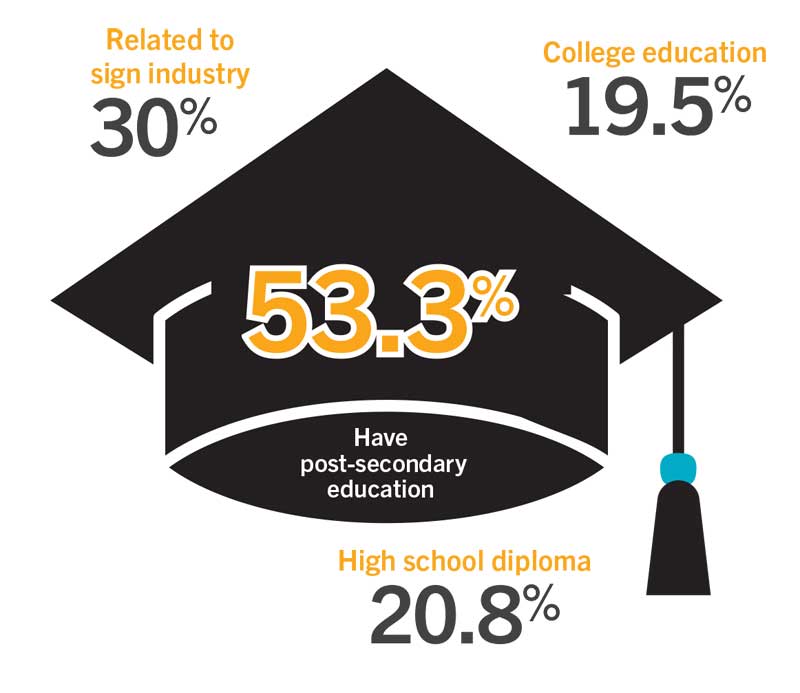 [7]
[7]
Job satisfaction
This year’s survey revealed 73.5 per cent of all respondents are happy with their jobs, with 38.2 per cent being “more satisfied” and 35.3 per cent being “equally satisfied” compared to five years ago. [8]
[8]
Working hours and benefits
Due to the nature of the business, the sign industry involves many occupations—from installers, fabricators, welders, and electricians to graphic designers, technical drafters, urban planners, permit specialists, sales representatives, and administrative staff. Depending on the project, deadlines, and teams involved, it may be necessary for certain employees to work longer hours. In fact, 31.9 per cent of respondents say they work between 41 and 50 hours per week, while another 33.3 per cent are on the job for more than 50 hours. Further, 30.6 per cent of respondents put in a typical 35-to-40-hour work week.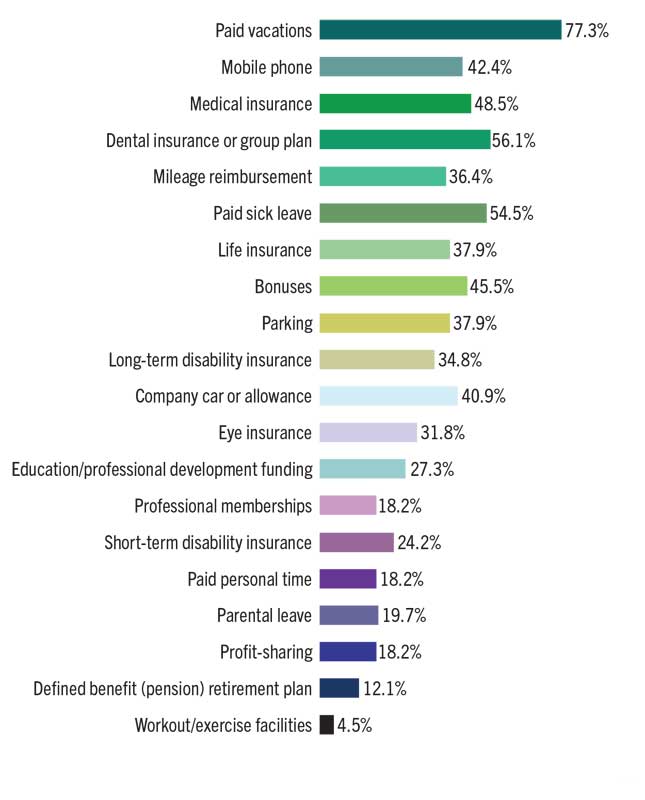 [9]
[9]
Industry associations
Professional associations help to connect similar businesses in the sign industry which all abide by a set code of ethics. These not-for-profit groups promote the welfare of the industry and the status of members in the community, as well as benefit the users of signs. The traditional boundaries of the sign industry have expanded due to advancements in technology and the evolution of the marketplace. Industry associations help members share knowledge with others by providing insight, guidelines, and, in some cases, industry best practices and standards. As a result, it can be helpful for companies to join these professional associations. Currently, 59.5 per cent of respondents are members of the Sign Association of Canada (SAC), while 42.9 per cent are members of the International Sign Association (ISA). Additionally, memberships to the Canadian Out-of-Home Marketing and Measurement Bureau (COMMB) and the Association of Registered Graphic Designers (RGD) have increased by 3.5 per cent and 1.9 per cent, respectively.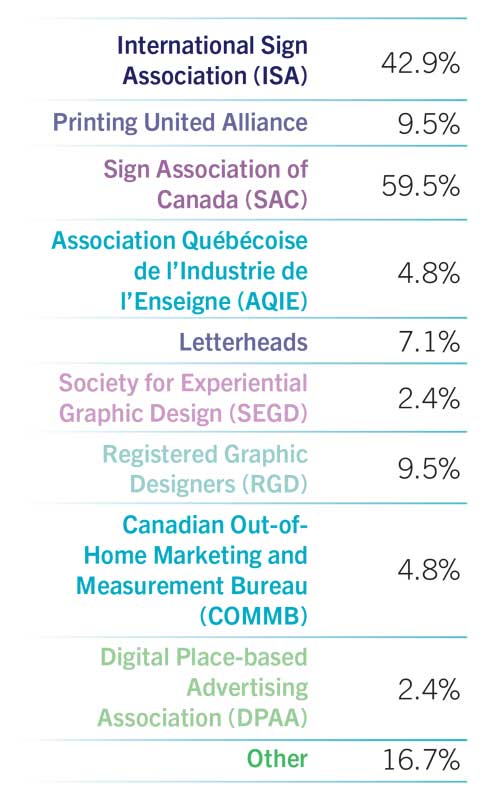 [10]
[10]
Company profiles
The companies surveyed were just as diverse as the professionals they employ with respect to size and areas of specialty. While economic uncertainty and the increasing costs of supplies were areas of concern last year, signmakers continue to remain optimistic that the industry is starting to bounce back. When asked what the approximate annual revenue of the business was this year, the top four answers were $250,000 to $599,999; $600,000 to $999,999; $1 million to $3 million; and $4 million to $9 million.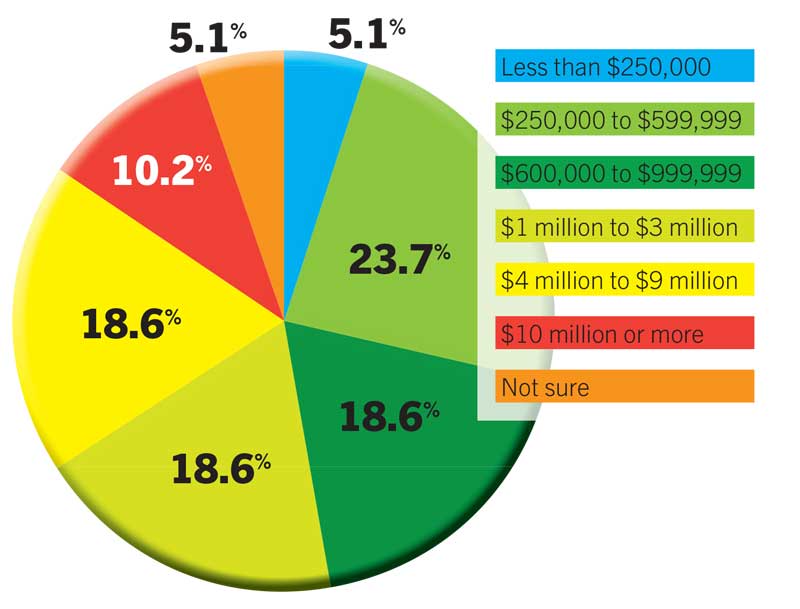 [11]
[11]
Key areas of business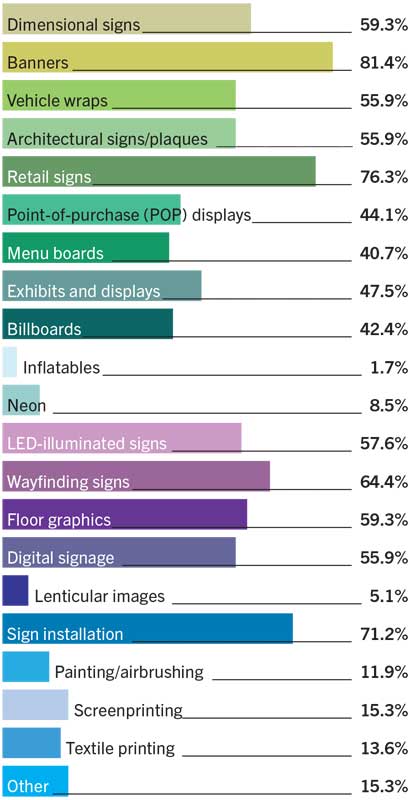 [12]
[12]
Social media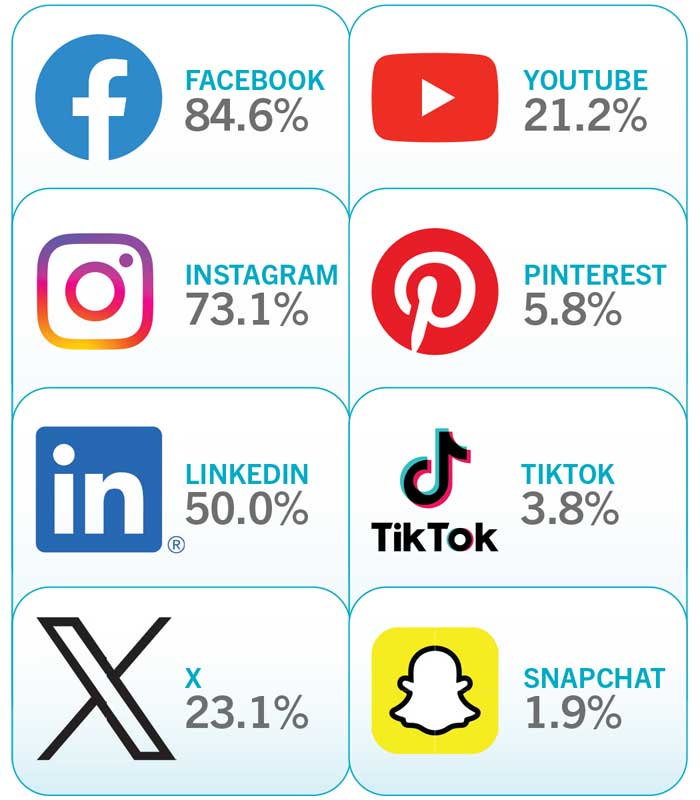 [13]
[13]
Staff size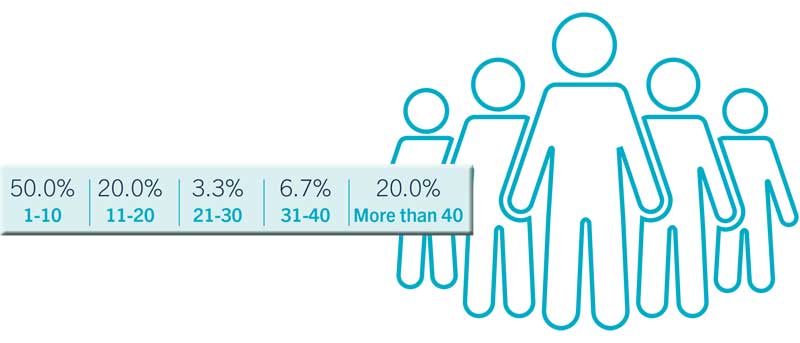 [14]
[14]
- [Image]: https://www.signmedia.ca/wp-content/uploads/2023/12/BasicDemo_Map.jpg
- [Image]: https://www.signmedia.ca/wp-content/uploads/2023/12/BasicDemo_MF.jpg
- [Image]: https://www.signmedia.ca/wp-content/uploads/2023/12/BasicDemo_Age.jpg
- [Image]: https://www.signmedia.ca/wp-content/uploads/2023/12/experience-and-career-path.jpg
- [Image]: https://www.signmedia.ca/wp-content/uploads/2023/12/WhoAreYou.jpg
- [Image]: https://www.signmedia.ca/wp-content/uploads/2023/12/WhoAreYou_Pay.jpg
- [Image]: https://www.signmedia.ca/wp-content/uploads/2023/12/education.jpg
- [Image]: https://www.signmedia.ca/wp-content/uploads/2023/12/education_Job-satisfaction.jpg
- [Image]: https://www.signmedia.ca/wp-content/uploads/2023/12/WorkingHours1.jpg
- [Image]: https://www.signmedia.ca/wp-content/uploads/2023/12/WorkingHours2.jpg
- [Image]: https://www.signmedia.ca/wp-content/uploads/2023/12/Company-profiles-.jpg
- [Image]: https://www.signmedia.ca/wp-content/uploads/2023/12/KeyBusiness.jpg
- [Image]: https://www.signmedia.ca/wp-content/uploads/2023/12/KeyBusiness_SocialMedia.jpg
- [Image]: https://www.signmedia.ca/wp-content/uploads/2023/12/KeyBusiness_StaffSize.jpg
Source URL: https://www.signmedia.ca/2023-salary-survey-how-signage-trends-continue-to-evolve-with-the-times/