
For years, large-format printing companies have struggled with customers demanding they print higher line half-tone counts, so their graphics will look better up close.
A brief history
While some inkjet and screenprinting shops also handle offset lithography, most do not, so print standards like Specifications for Web Offset Publications (SWOP) and General Requirements for Applications in Commercial Offset Lithography (GRACoL)—which are designed specifically for offset printing’s paper, inks and dot gains—do not apply well to their in-house processes.
So, in the past, wide-format print houses spent a lot of time on colour matching, i.e. trying to get graphics to appear as close as possible to offset-printed proofs. Unless a graphic is printed with the same process and inks on the same substrate, however, there is always going to be some degree of deviation in colour.
Print shops established colour matching departments and hired specialists in an effort to support the industry-wide claim that any colour on a proof could be reproduced accurately. Production departments, however, worked with more toward achieving similar colour, due to restrictions and limitations in terms of time, materials and equipment.
This tradition of colour matching was focused on spot colours, based on fabric swatches or the Pantone Matching System (PMS). It became common for print shops to be asked to match very specific corporate colours, such as Coca-Cola red or Pepsi blue. And when directly comparing two solid or spot colours side-by-side, it is easy for the human eye—let alone a colour testing system—to discern subtle differences between them.
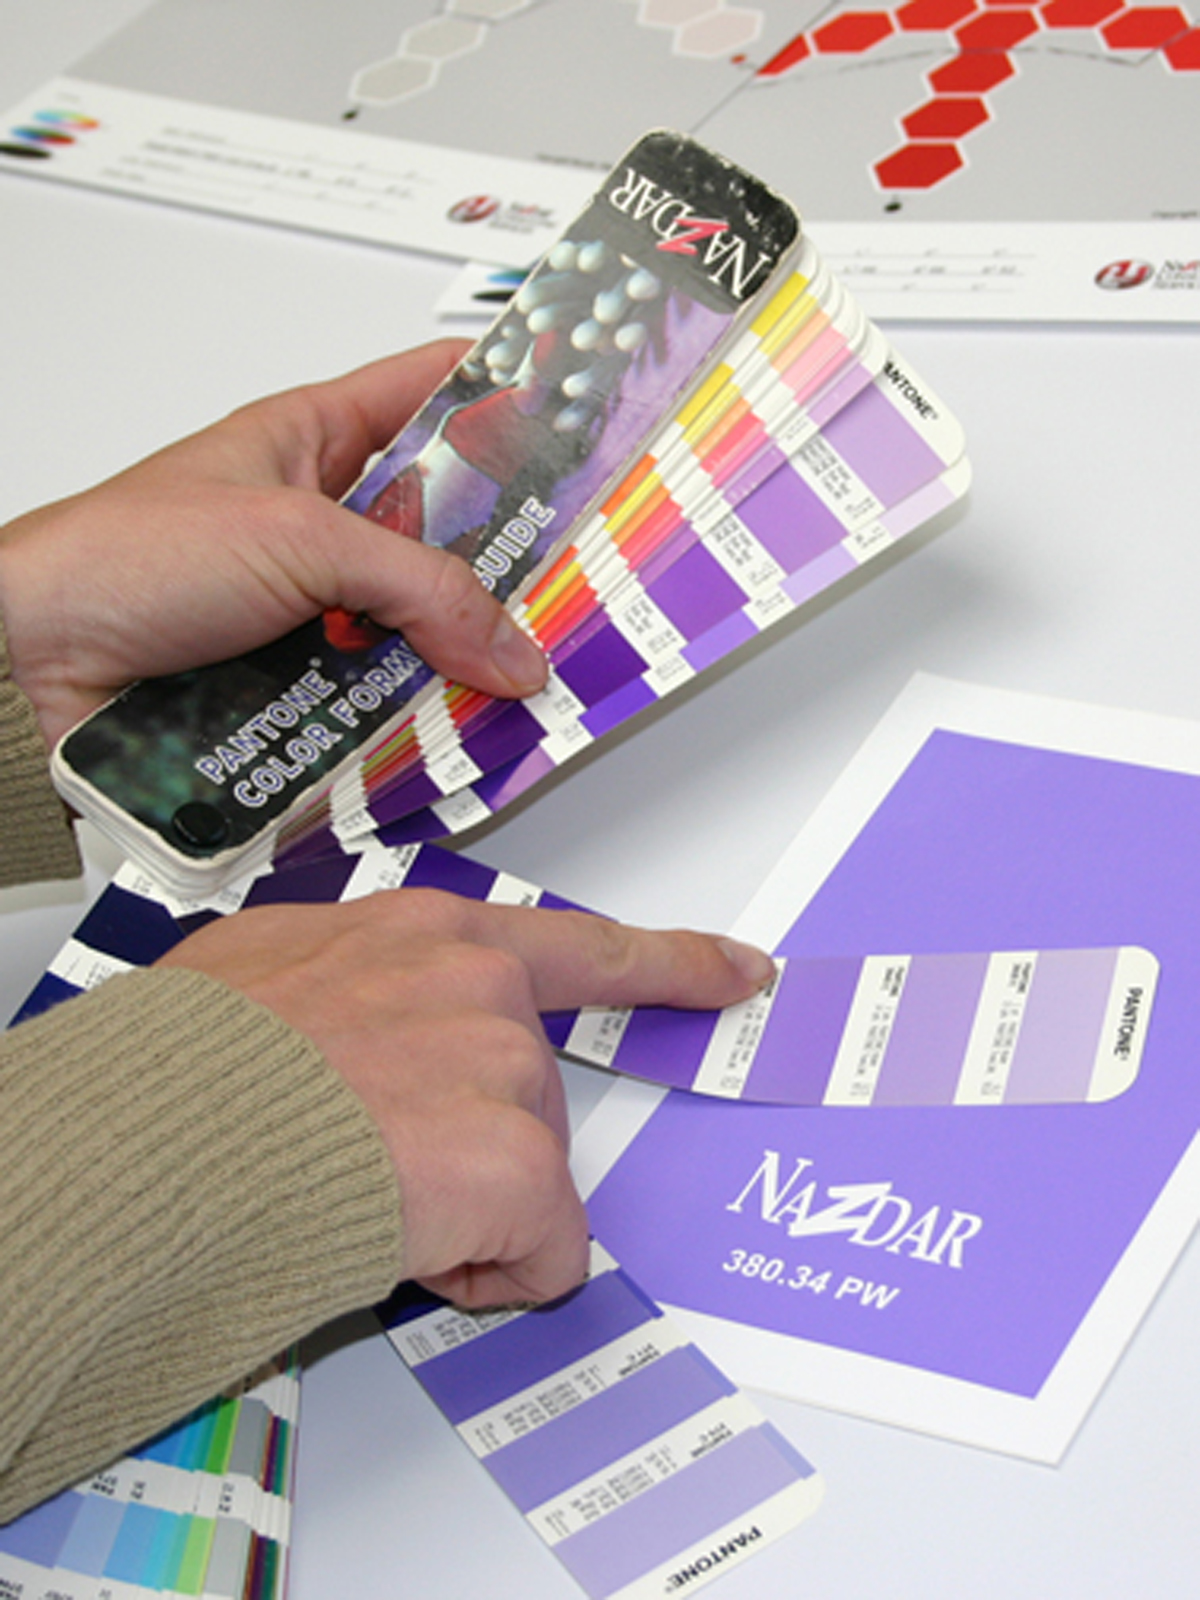
In the past, colour matching has relied on swatches and the Pantone Matching System (PMS).
This evolved into a science of spot colour matching, requiring the removal of subjectivity from the process. The practice of measuring colours and ‘quantifying’ them by assigning numbers was developed and became known as spectrophotometry. Even then, however, the mathematical formulas allowed some tolerance of deviation from a standard within a limited range.
The L*a*b* colour space became the most common model used to measure colour. This involved assigning numbers to define a given colour’s location in the space. It remained difficult, however, to compare two colours within the space, so formulas were developed to help quantify the difference.
These formulas did not weigh various colours differently, though the human eye tends to perceive subtle variations at a lower or greater degree in different colours. Two measured greys, for example, will appear more visually different from each other than two bright reds. This is due to the way the human eye sees slight colour shift differences in neutral colours.
And this is why the G7 methodology is so effective: full-colour images are separated and controlled with neutral greys.
On the spot
G7 does not assist with spot colour matching or simulation, nor does it use the same substrate ‘white point’ solid ink densities, dot gain or tone value increase (TVI). Rather, it is designed to control process colour images by setting neutral density curves for cyan, magenta and yellow inks, based on how they are printed individually, as well as together to create the ‘overprint’ secondary colours. The methodology focuses on balancing the relationship between these three colours in an image where there may be thousands of colours.
Most spot colour matching information remains relevant, as G7 still requires the print provider to measure colours with a spectrophotometer, which means first learning and understanding the L*a*b* colour space. The spot colour ‘mentality,’ i.e. of matching one specific colour to another, however, is not usually the goal of the G7 process.


